How Efficient is our Solar Setup? 2 Year Report
Two years ago, we installed a solar array on the roof of our truck camper. The ten-panel array looks impressive. But how efficient is it, really? Today, we are reviewing the amps, volts, and watts yielded to determine how efficient our solar setup really is.

Solar Power for RV Living
Powering an RV can be very simple if limiting. There are plenty of RV parks with full hookups that provide the conveniences of grid living for a mobile lifestyle. But for people like us, who prefer to live off-grid, solar power is more than an auxiliary backup to keep the camper in maintenance mode. It is our primary power source.
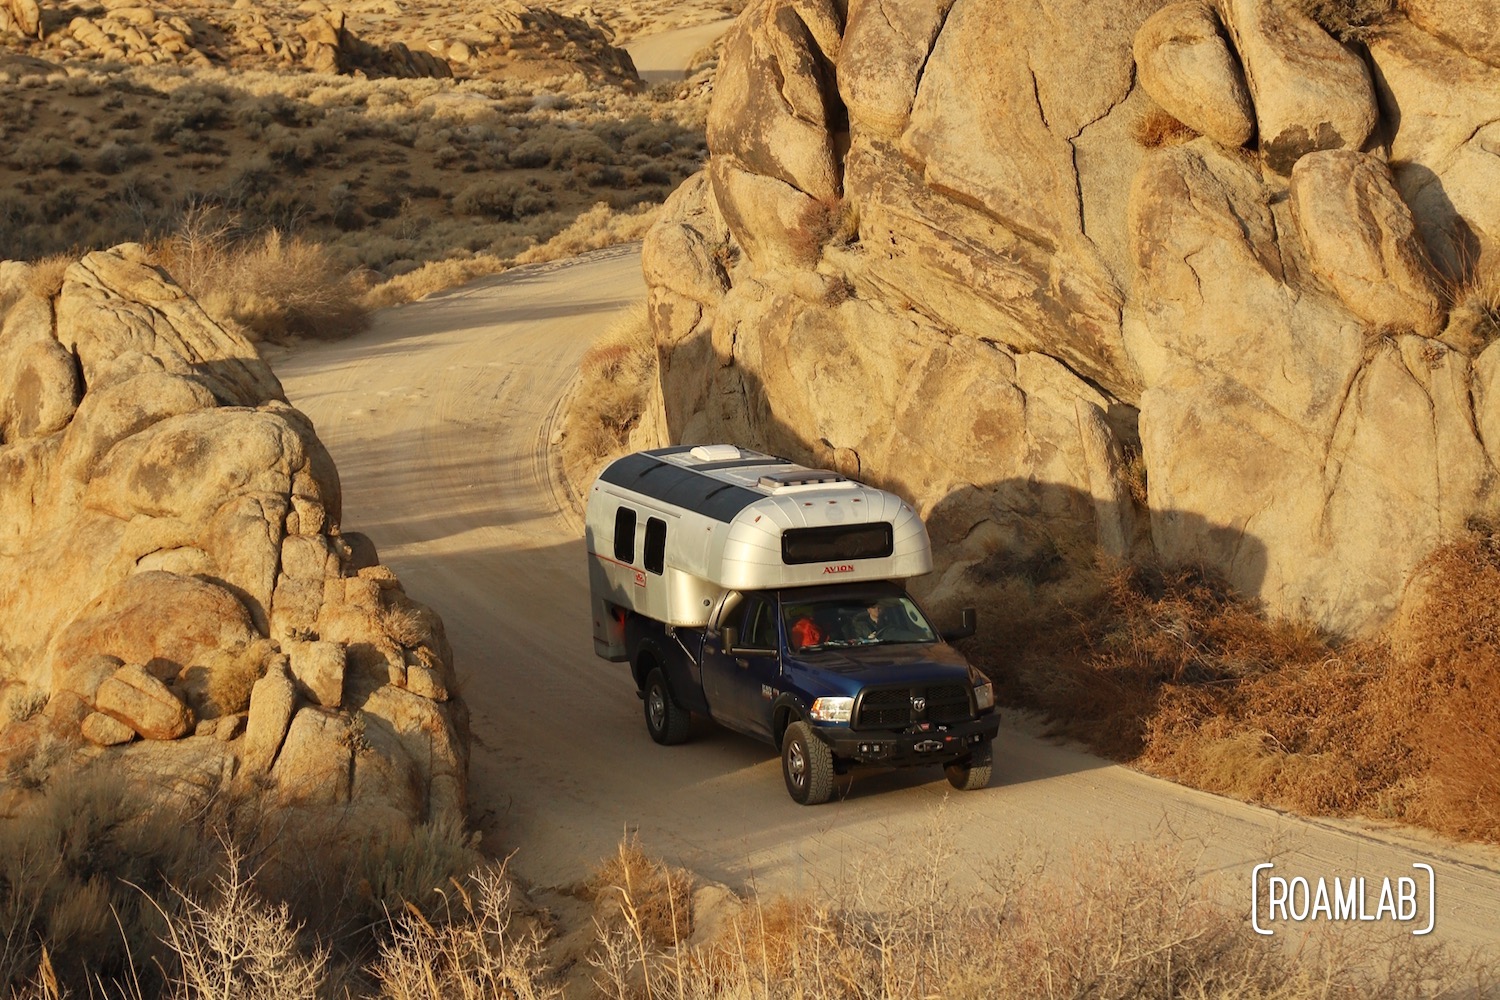
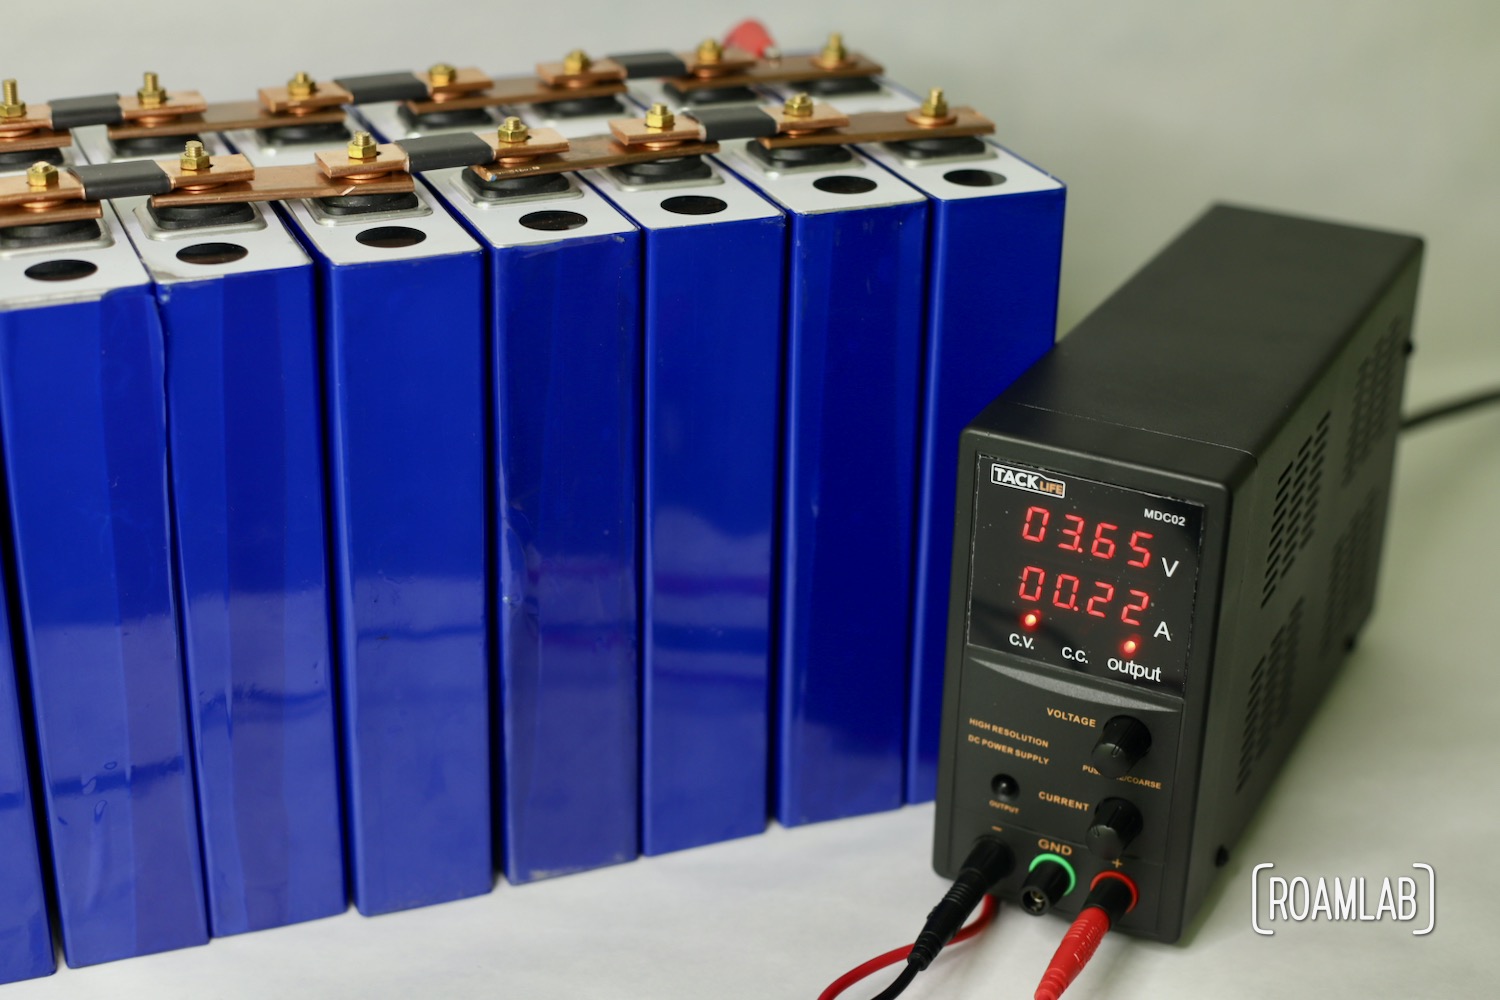
When we gutted our vintage 1970 Avion C11 truck camper we removed all the propane tanks and related appliances. Instead, our new camper is fully electric with an 8640-watt DIY LiFePO4 battery bank, a roof covered in solar panels, and some backup power from our alternator. Where many RVs fall back on propane to run their power-hungry heaters, AC units, refrigerators, and microwaves, we depend on our solar power. So every amp counts.

Installing Solar Panels
Like so many of our projects, our solar array is far from the ordinary RV arrangement. The curved roof of our Avion truck camper poses an odd challenge: how many solar panels can we reasonably install on our camper? It is a long and involved debate that we meticulously documented in our post How Many Solar Panels Should I Buy For My Truck Camper? But in the end, we agree that we will install ten: eight flexible panels hugging the curved edges of the roof and two semi-rigid panels centered on the top.


A Hypothesis
With our solar panels selected and installed, we can estimate our anticipated power for our solar setup. Solar panels come with ratings for their potential output. Each of the ten panels installed is rated for a max output of 5.93 Amps at 18.56 volts for a total of 110watts. The panels are wired in serial sets of two and then connected in the junction box in parallel, to create a 2S5P system.
Altogether, our solar setup should add up to a potential output of 29.65 amps at 37.12 volts for a total of 1100W. Victron, the manufacturer of our solar charger estimates that an 1100 W array will yield an average of 4,000 Wh per day.
But all of this is conjecture. A hypothesis, if you will. Solar output varies by the time of year and other environmental factors. But that kind of average should have us sitting pretty. When we installed the panels, we were confident that, if anything, we were overdoing it. After two years, however, the data tells a different story.

The Different Story: Untangling Solar Output Data
Our Victron solar charger not only regulates the incoming voltage and amperage from our solar array, but it also logs how much is coming in and how it is managed. When the batteries are low, the solar charger pushes in the amps in bulk mode. As the batteries reach full capacity, the solar charger pulls on the throttle for a more controlled absorption mode. Once the batteries are full, the solar charger cuts off any more flow and sits in float until power is needed again. And throughout it all, the solar charger logs the voltage, amperage, wattage, and time in bulk, absorption, and float. Well, at least for some of the time.
A Note on the Data and Conditions
While we have had the solar panels in operation since October 2020, it appears that the logs beyond the last 30 days were purged. As a result, we only have data for our solar setup from July 7th to August 6th. For reasons we’ll get into later, we don’t have relevant data beyond August 6th.
This purge is unfortunate for many reasons. We are missing out on the ability to compare average seasonal or location-based solar yield. But at the very least, the data we do have represents some of the longest days of 2022, starting shortly after the summer solstice. Even on August 6th, the most recent date recorded, the sun rose at 5:57 AM and set at 7:48 PM, making for nearly 14 hours of daylight.
On the other hand, this data block also coincides with a build period for our camper. As a result, the camper—and, thus, the solar array—is off the truck and parked in a static location. While there is nothing directly above the camper, there are tall trees nearby that shade the roof in the early morning and evening. Thankfully these represent periods with the least solar to collect. So, the data we do have represents the peak sun and hours.

30 Days of Solar Power
With these long summer days, we hope to see the solar panels maximize their potential output. The array can generate a maximum of 1100 watts. But, referring to our data mapped out in Table 1 below, we only record a peak output of 720 watts.
Our daily yield is similarly disappointing. We estimated that the solar array should generate 4,000 watts per day. Even on our best day, however, we have a total yield of 2,130 watts, almost half what we anticipated. Even more disheartening, across the full 30 days, we average only 1466 watts per day.
To be fair, despite the long days we are experiencing, we are in a humid climate. And while the weather cannot account for all of the missing watts, it certainly can account for the variation from day to day as we layer in weather data in Table 2 below.
Daily solar yield and max power output for from July 7 to August 6th, 2022
| Date | Yield (Wh) | Max. PV power (W) | Max. PV voltage (V) | Time in bulk (m) | Time in absorption (m) | Time in float (m) |
|---|---|---|---|---|---|---|
| 7/7/22 | 1400 | 642 | 37.81 | 802 | 0 | 0 |
| 7/8/22 | 1860 | 720 | 39.19 | 525 | 0 | 0 |
| 7/9/22 | 1220 | 645 | 39.96 | 247 | 0 | 0 |
| 7/10/22 | 150 | 81 | 38.87 | 233 | 0 | 0 |
| 7/11/22 | 2040 | 697 | 38.23 | 841 | 0 | 0 |
| 7/12/22 | 1590 | 425 | 37.85 | 839 | 0 | 0 |
| 7/13/22 | 1360 | 649 | 41.16 | 514 | 312 | 0 |
| 7/14/22 | 1260 | 699 | 41.44 | 511 | 152 | 170 |
| 7/15/22 | 1270 | 537 | 41.26 | 571 | 134 | 135 |
| 7/16/22 | 1250 | 603 | 40.94 | 679 | 126 | 17 |
| 7/17/22 | 1060 | 613 | 38.15 | 797 | 0 | 0 |
| 7/18/22 | 1790 | 695 | 37.76 | 832 | 0 | 0 |
| 7/19/22 | 1540 | 647 | 40.59 | 553 | 160 | 98 |
| 7/20/22 | 1160 | 665 | 38.71 | 436 | 0 | 0 |
| 7/21/22 | 220 | 106 | 38.68 | 247 | 0 | 0 |
| 7/22/22 | 2060 | 576 | 38.22 | 832 | 0 | 0 |
| 7/23/22 | 2130 | 595 | 36.74 | 818 | 0 | 0 |
| 7/24/22 | 1750 | 720 | 40.27 | 820 | 0 | 0 |
| 7/25/22 | 1320 | 468 | 37.57 | 781 | 0 | 0 |
| 7/26/22 | 1510 | 643 | 37.18 | 808 | 0 | 0 |
| 7/27/22 | 1900 | 621 | 37.12 | 817 | 0 | 0 |
| 7/28/22 | 1590 | 650 | 37.03 | 800 | 0 | 0 |
| 7/29/22 | 1230 | 741 | 37.76 | 758 | 0 | 0 |
| 7/30/22 | 1520 | 674 | 37.88 | 821 | 0 | 0 |
| 7/31/22 | 1290 | 441 | 37.38 | 822 | 0 | 0 |
| 8/1/22 | 1750 | 618 | 37.79 | 809 | 0 | 0 |
| 8/2/22 | 2130 | 602 | 37.42 | 808 | 0 | 0 |
| 8/3/22 | 1990 | 629 | 39.48 | 718 | 101 | 0 |
| 8/4/22 | 1450 | 467 | 39.41 | 813 | 0 | 0 |
| 8/5/22 | 1460 | 494 | 40.51 | 659 | 136 | 0 |
| 8/6/22 | 1200 | 705 | 38.93 | 448 | 0 | 0 |

Environmental Variables On Solar Yield
There are a lot of variables that can affect the solar draw, but it is particularly interesting to see what difference weather can play in solar yield. The difference that light fluffy clouds can make while passing in front of the sun is dramatic. And over the last 30 days, there have been a lot of clouds. Even on our best recorded producing day, August 2nd, we experience scattered clouds. And while these clouds do mute the results, passing clouds also make room for the direct sun at other points.
Such is the case on July 8th, a day of scattered clouds and yet our highest wattage. On that day, the solar array manages to peak at 720 watts. That’s 380 watts less than it is capable of. But there could be another environmental variable at play as well: the heat.
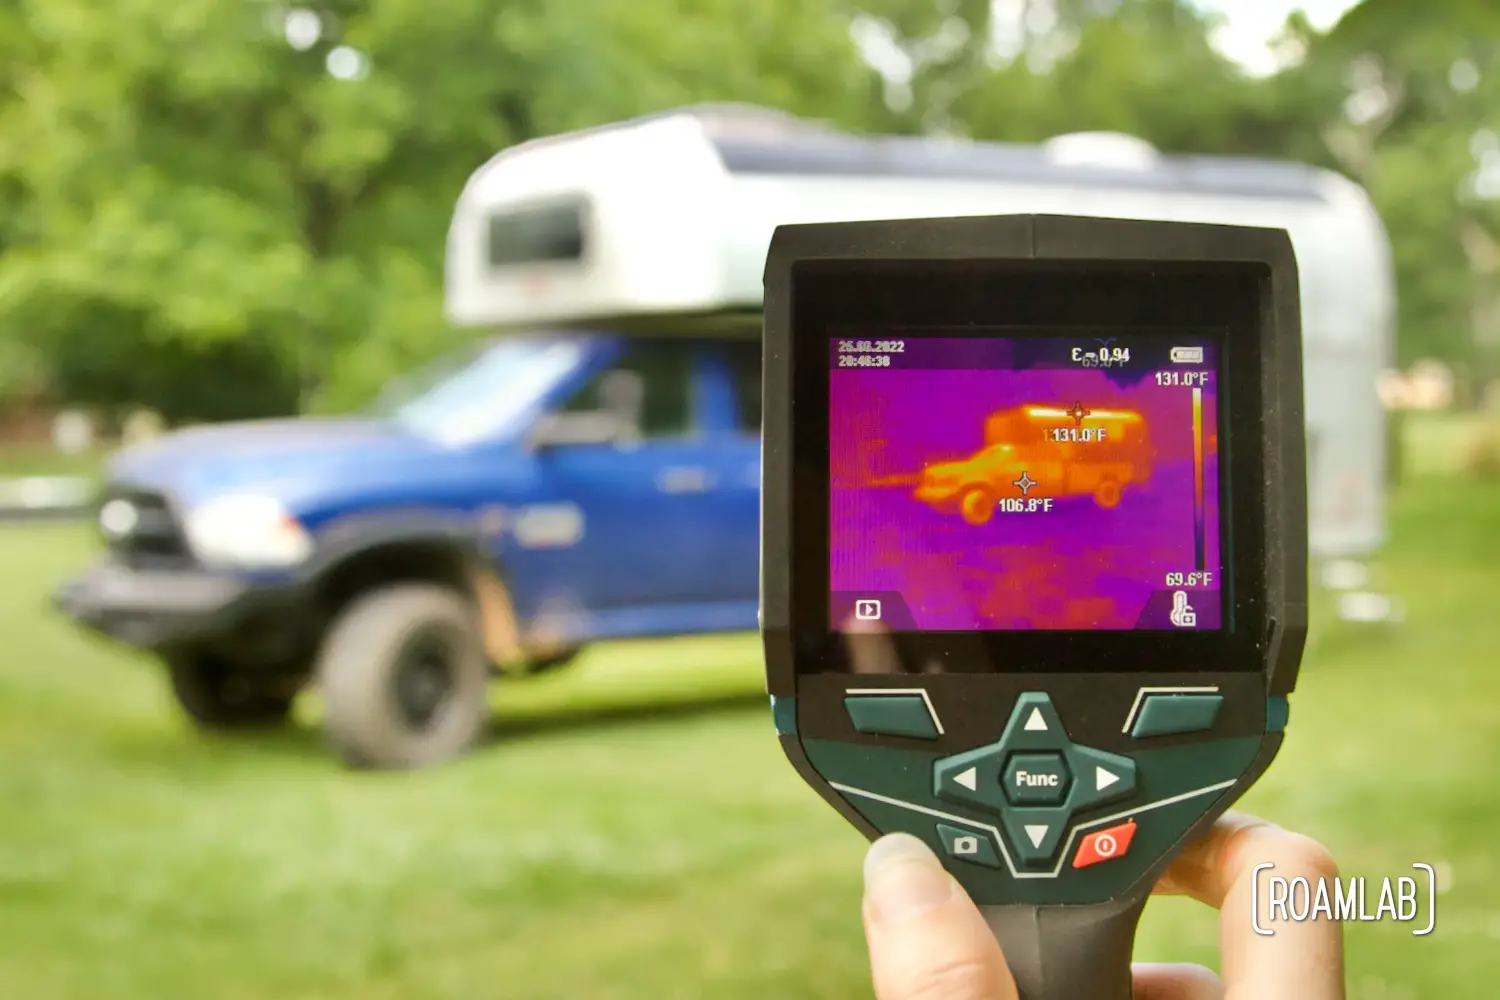
Solar panels are rated to operate within a given temperature range. Our panels have a maximum operating threshold of 185°F (85°C). That may seem like a high threshold. But these black panels exposed to direct sunlight on a hot summer day can reach temperatures far higher than the ambient temperatures. And as the panels overheat, their output drops. So, along with the clouds, the summer heat is another mitigating factor.
Solar Setup Daily Yield & Weather Conditions
| Date | Yield(Wh) | Max. PV power(W) | Average Temperature | Sky |
|---|---|---|---|---|
| 7/7/22 | 1400 | 642 | 81.8°F (°C) | Mostly Cloudy |
| 7/8/22 | 1860 | 720 | 83.6°F (°C) | Scattered Clouds |
| 7/9/22 | 1220 | 645 | 78.4°F (°C) | Broken Clouds |
| 7/10/22 | 150 | 81 | 79.2°F (°C) | Partly Sunny |
| 7/11/22 | 2040 | 697 | 81.5°F (°C) | Passing Clouds |
| 7/12/22 | 1590 | 425 | 82.9°F (°C) | Broken Clouds |
| 7/13/22 | 1360 | 649 | 80.8°F (°C) | Broken Clouds |
| 7/14/22 | 1260 | 699 | 81.0°F (°C) | Scattered Clouds |
| 7/15/22 | 1270 | 537 | 82.8°F (°C) | Broken Clouds |
| 7/16/22 | 1250 | 603 | 84.3°F (°C) | Broken Clouds |
| 7/17/22 | 1060 | 613 | 83.3°F (°C) | Partly Sunny |
| 7/18/22 | 1790 | 695 | 77.2°F (°C) | Partly Sunny |
| 7/19/22 | 1540 | 647 | 81.1°F (°C) | Broken Clouds |
| 7/20/22 | 1160 | 665 | 88.2°F (°C) | Scattered Clouds |
| 7/21/22 | 220 | 106 | 85.8°F (°C) | Scattered Clouds |
| 7/22/22 | 2060 | 576 | 85.4°F (°C) | Passing Clouds |
| 7/23/22 | 2130 | 595 | 87.1°F (°C) | Scattered Clouds |
| 7/24/22 | 1750 | 720 | 85.7°F (°C) | Broken Clouds |
| 7/25/22 | 1320 | 468 | 82.5°F (°C) | Broken Clouds |
| 7/26/22 | 1510 | 643 | 80.4°F (°C) | Partly Sunny |
| 7/27/22 | 1900 | 621 | 85.8°F (°C) | Broken Clouds |
| 7/28/22 | 1590 | 650 | 82.0°F (°C) | Broken Clouds |
| 7/29/22 | 1230 | 741 | 77.9°F (°C) | Broken Clouds |
| 7/30/22 | 1520 | 674 | 78.7°F (°C) | Broken Clouds |
| 7/31/22 | 1290 | 441 | 79.0°F (°C) | Broken Clouds |
| 8/1/22 | 1750 | 618 | 80.2°F (°C) | Broken Clouds |
| 8/2/22 | 2130 | 602 | 84.3°F (°C) | Scattered Clouds |
| 8/3/22 | 1990 | 629 | 83.3°F (°C) | Scattered Clouds |
| 8/4/22 | 1450 | 467 | 82.0°F (°C) | Broken Clouds |
| 8/5/22 | 1460 | 494 | 80.4°F (°C) | Broken Clouds |
| 8/6/22 | 1200 | 705 | 81.5°F (°C) |
Hourly Output for our Solar Setup
While the total daily yield and max power vary dramatically by day, some hourly patterns might shed light on our perceived solar shortage. Over our 30-day record, we can see a notable period that represents some of the highest total yield and power on the weekend of 7/23/22 and 7/24/22. So, we are breaking down this period to highlight the efficiency.
7.23.2022 Solar Array Output
Saturday, July 23, 2022, marks the highest total solar yield of any one day within the recorded 30-day period. Yet, the jagged shape of this graph is far from what one would expect on a high yield day. Rather than the graceful curve of rising and setting power mirroring the arc of the sun’s trajectory through the sky, we see abrupt edges where solar wattage dips, potentially due to a combination of clouds and tree shade.
One can’t help but wonder what a full day’s charge would look like on a clear, unobstructed, sunny day. The shape of the graph certainly hints that the panels are capable of a higher daily yield under better conditions. Hopefully, we’ll be able to report on that sometime soon.
Hourly solar array power output for July 23, 2022
| Time | PV Voltage (V) | PV Current (A) | PV Power (W) |
|---|---|---|---|
| 12 AM | 0.72 | 0.00 | 0 |
| 1 AM | 0.72 | 0.00 | 0 |
| 2 AM | 0.72 | 0.00 | 0 |
| 3 AM | 0.97 | 0.00 | 0 |
| 4 AM | 1.04 | 0.00 | 0 |
| 5 AM | 31.21 | 0.00 | 0 |
| 6 AM | 30.02 | 0.67 | 20 |
| 7 AM | 32.99 | 1.21 | 40 |
| 8 AM | 33.56 | 1.64 | 55 |
| 9 AM | 35.02 | 4.77 | 167 |
| 10 AM | 34.96 | 2.72 | 95 |
| 11 AM | 33.51 | 6.51 | 218 |
| 12 PM | 31.43 | 18.68 | 587 |
| 1 PM | 31.41 | 18.75 | 589 |
| 2 PM | 32.09 | 14.99 | 481 |
| 3 PM | 32.48 | 8.65 | 281 |
| 4 PM | 32.68 | 2.08 | 68 |
| 5 PM | 34.26 | 1.46 | 50 |
| 6 PM | 31.66 | 1.14 | 36 |
| 7 PM | 30.52 | 0.33 | 10 |
| 8 PM | 24.77 | 0.00 | 0 |
| 9 PM | 0.92 | 0.00 | 0 |
| 10 PM | 0.97 | 0.00 | 0 |
| 11 PM | 0.97 | 0.00 | 0 |
7.24.2022 Solar Array Output
Sunday, July 24th marks the highest spike in solar power recorded over our 30-week period. Even so, we see it’s a clear and short-lived peak, similar to Saturday. Between noon and 1 pm, the solar array maxes out at 625 and 675W respectively. Yet, immediately before and after, the yield drops to 282 at 11 AM and 115 at 2 PM.
If nothing else, we can appreciate to what degree environmental factors can have an outsized effect on the amount of solar we generate in a day. Cloudy days and shady spots don’t negate the possibility of generating power. They just severely decrease it.
Hourly solar array power output for July 24, 2022
| Time | PV Voltage (V) | PV Amperage (A) | PV Power (W) |
|---|---|---|---|
| 12 AM | 0.98 | 0.00 | 0 |
| 1 AM | 0.98 | 0.00 | 0 |
| 2 AM | 0.97 | 0.00 | 0 |
| 3 AM | 0.98 | 0.00 | 0 |
| 4 AM | 0.98 | 0.00 | 0 |
| 5 AM | 26.03 | 0.00 | 0 |
| 6 AM | 31.76 | 0.41 | 13 |
| 7 AM | 32.74 | 1.10 | 36 |
| 8 AM | 33.75 | 1.96 | 66 |
| 9 AM | 34.7 | 5.85 | 203 |
| 10 AM | 35.28 | 4.34 | 153 |
| 11 AM | 35.75 | 7.89 | 282 |
| 12 PM | 33.38 | 18.72 | 625 |
| 1 PM | 33.56 | 20.11 | 675 |
| 2 PM | 32.55 | 3.53 | 115 |
| 3 PM | 36.01 | 5.83 | 210 |
| 4 PM | 34.51 | 4.46 | 154 |
| 5 PM | 34.45 | 2.24 | 77 |
| 6 PM | 32.68 | 2.17 | 71 |
| 7 PM | 31.79 | 0.66 | 21 |
| 8 PM | 25.46 | 0.00 | 0 |
| 9 PM | 0.72 | 0.00 | 0 |
| 10 PM | 0.72 | 0.00 | 0 |
| 11 PM | 0.72 | 0.00 | 0 |
Breaking Out A Week
Over the 23rd and 24th, we start to see a pattern in the short-lived peaks. To confirm our suspicions, we extend the test into the week to compare the output between the dates July 23 and 29. Overlaying the hourly output, it’s pretty clear that we consistently see a minor peak in the mid-morning followed by a drop and a more pronounced peak around noon and 1 pm. The fault is environmental but the consistent form of this graph across the week indicates that our problem is not the weather. The trees that the camper is parked next to that shade the panels in the morning and afternoon.
That’s one mystery solved…
Hourly solar power output from July 23 to 29, 2022
Conclusions
Our results are far from what we anticipated when we first installed the panels. While environmental conditions play a part in the disappointing solar output of our array, it is far from the full explanation. Something is wrong. It could be wiring. It could be the arrangement. It could be the panels themselves. But whatever the problem is, to continue in our current arrangement is impractical. We should have the capacity to generate twice as much power as we currently are. Power that we are sorely missing to run our air conditioning and other necessities to make it through our current heat wave. We have to find what is wrong and fix it.

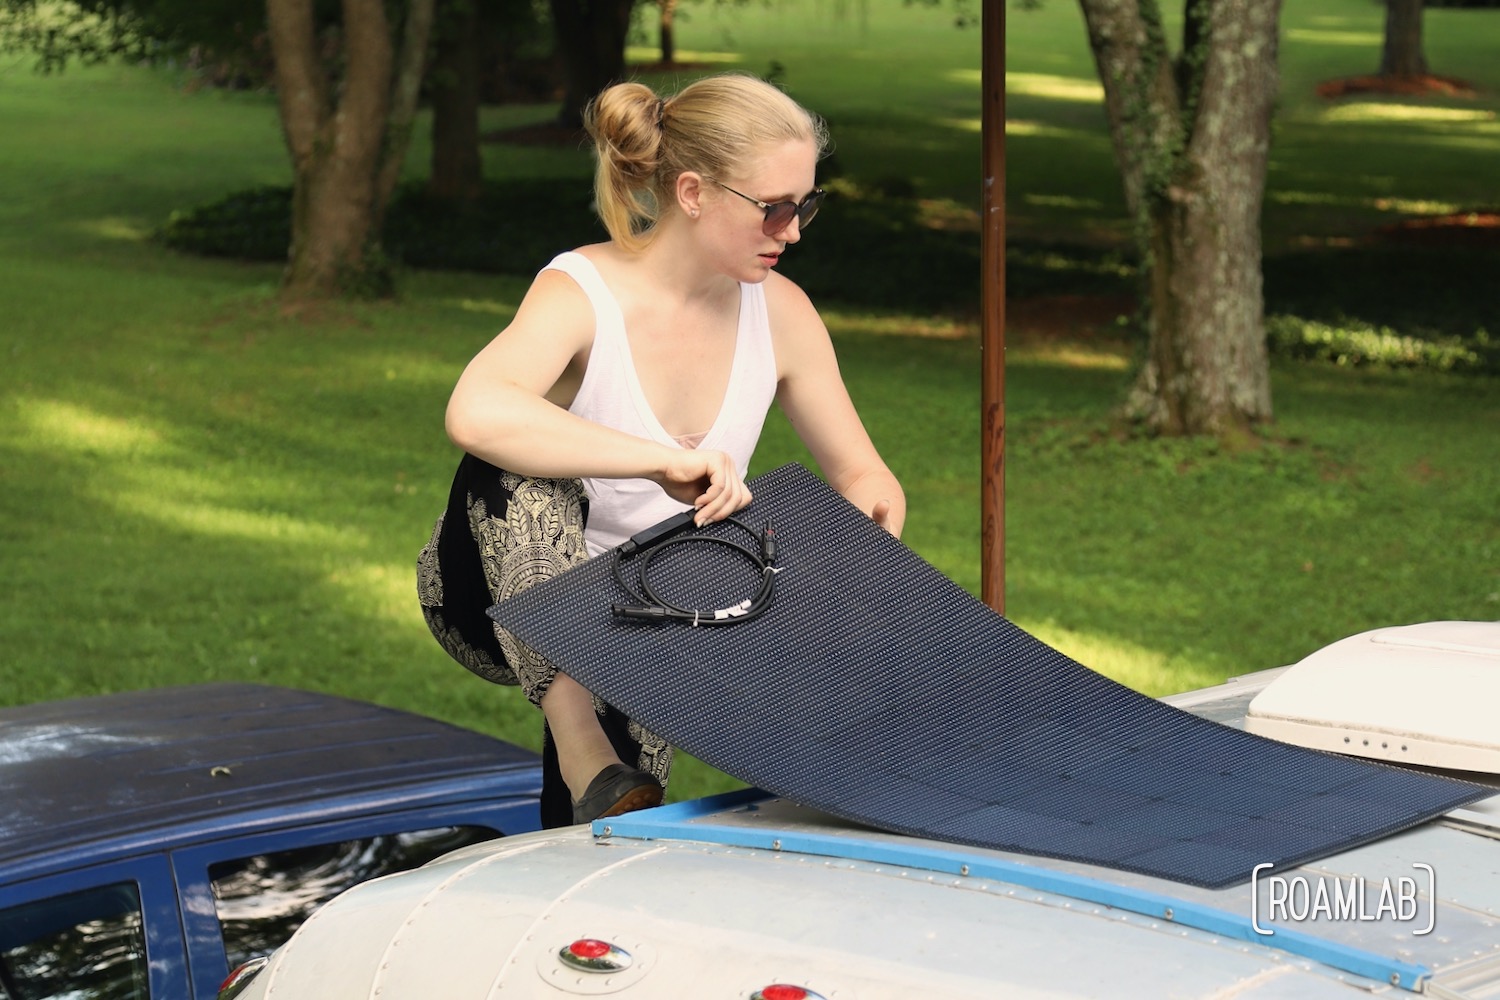
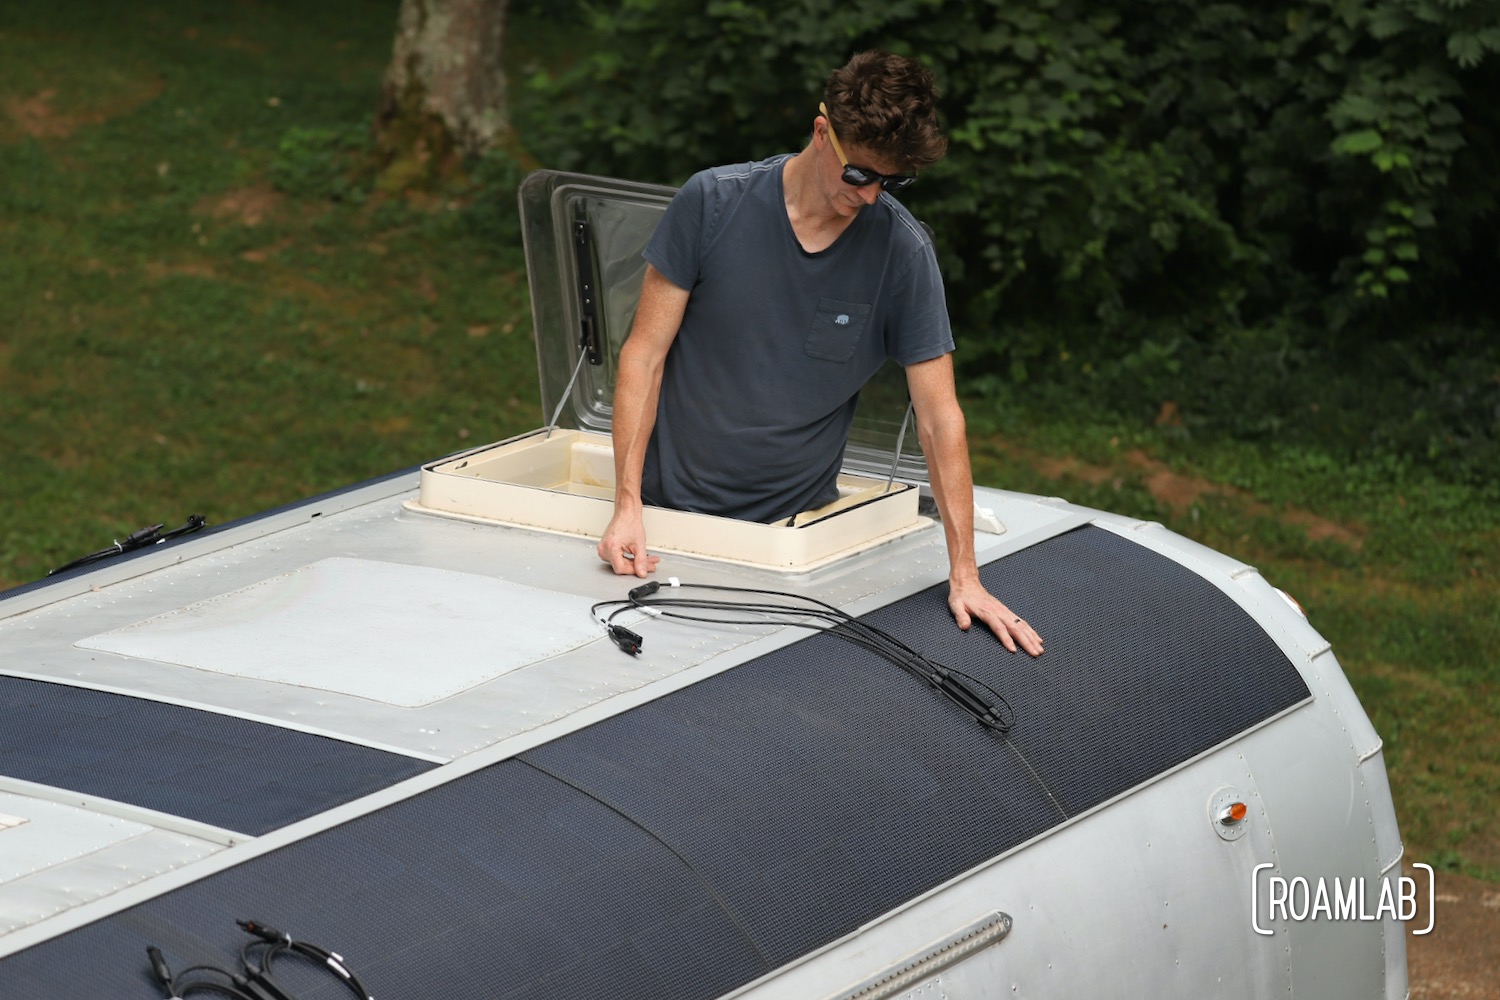
What’s Next for Our Solar Setup?
Before we can fix our solar array, we need to identify what is causing our poor output. And that calls for one of our favorite activities: running experiments. We have started a list of questions to answer:
- Are any of the individual panels underperforming and limiting overall yield?
- Is there a problem with how we wire our panels?
- How dramatically does heat affect the output of solar panels? And how effective are cooling methods?
- Does the curve of our camper roof affect our solar output?
I suppose there is another big question that we’ve left hanging throughout this article: why is there no more data after August 6th? It’s nothing to worry about. Given the less than stellar results from our last 30-days of solar power collection. we preparing to run some experiments to see what we can do to improve our output. To this end, we are disassembling our solar and power setup to test a few configurations to improve our yield. So keep an eye out for upcoming posts about our findings.


Steve
Good Article. Love your camper. Enjoyed your LBL coverage. We spend time there regularly. As for solar output, It seems you have several factors working against you; Position, panel type, airflow. The curvature has to be your biggest problem – while one side might be receiving optimal sun, the other would be angled away receiving little. I sun is directly overhead, neither side will receive what a flat panel might. Flexible panels aren’t quite as effient as fixed. Also, lack of air flow beneath the panels increases panel temperature again negatively affecting output as you have noted. On a positive note, your, aluminum camper might help to dissipate some heat, but, probably not enough – this might be good for winter camping (warming up the camper). Just might thoughts. Perhaps not optimal but, still looks great. Might try a couple more flat panels (or moving existing) on flat section of roof top.
Lexi GoForth
Thank you, Steve!
LBL certainly deserves as enthusiastic a recommendation as we can give.
When it comes to the panels, yes, the shape of the camper certainly introduces a particular challenge. While we don’t have the logs, we do remember how some of our most stand out solar days included a thin haze or light layer of clouds which diffused the light and lead to more even yeild across the solar array. But it’s far from our average experience.
The panels definitely can get hot (more on that coming soon). And while the aluminum roof doesn’t get as hot as the panels, it’s still pretty hot on its own. So, it has limited use as a heat sink.
We’re looking at adding more panels on top but that will cost us our fan which is cause for some concern.
Either way, it’s a compromise, like most things. But it looks like we have a series of sunny days in the forecast. So I think we’ll be running some experiments and having some new plans coming soon.
Moonbat
I like the looks of the curved panels but I’m sure you’ve thought about how that affects their output. Especially when one side is angled towards the sun – that means the other side is angled away from the sun. It will be interesting to see what results you get when your tests are done. If you’ve been living with it like this for two years it must be working fairly well even if it’s less than what you had hoped for. And last, has there been any improvements in solar panel design since you installed these? Good luck!
Lexi GoForth
Hi Moonbat! Yeah, the curve does have its downsides. Though, short of having panels that would follow the sun, we had to make a call between keeping the camper aerodynamic or optimize the solar output. And we didn’t have the heart to mess with that vintage streamlined look too much.
We have managed well enough with the solar output up until this summer. The heat wave in June was a rude awakening from what had been reasonably mild weather. Our air conditioner was running full blast and could not keep up with the interior heat. So we need to upgrade the unit along with several other new electric appliances that will be requiring additional power. So, that means some modifications to our solar array as well. Here’s hoping we have some good results!